Category: Information Systems

Two Excercise Questions From Operational Excellence

1.How is the IT function organized in your school or place of 

employment? Create an organization chart showing how the IT 

organization fits into your overall organization. Comment on 

how centralized or decentralized the IT function is. (300 to 350 words)

No plagiarism , references required

2. Which software-development methodology would be best if an 

organization needed to develop a software tool for a small 

group of users in the marketing department? Why? Which 

implementation methodology should they use? Why? (300 to 350 words)

No plagiarism , references required

**Note: Remember, in APA, if you have a source in your reference list you must have an in-text citation for that source.**

Research

Background: Quantitative data can be measured and documented with numbers. Additionally, quantitative data can be represented as quantities. On the other hand, qualitative data is not measured with numbers, but it is represented by qualities. For example, I use quantitative methods to conduct my PhD research because I like working with counts and measures.

Assignment: Write a research paper the contains the following:

  • Discuss Quantitative Methodology
  • Discuss Qualitative Methodology
  • Compare and contrast qualitative data vs quantitative data

Your research paper should be at least 3 pages (800 words), double-spaced, have at least 4 APA references, and typed in an easy-to-read font in MS Word (other word processors are fine to use but save it in MS Word format).

Assignment 4


DEVELOPING INTIMACY WITH YOUR DATA

This exercise involves you working with a dataset of your choosing. Visit the website, browse through the options and find a dataset of interest, then follow the simple instructions to download it. With acquisition completed, work through the remaining key steps of examining, transforming and exploring your data to develop a robust familiarisation with its potential offering:

Examination: Thoroughly examine the physical properties (type, size, condition) of your dataset, noting down useful observations or descriptions where relevant.

Transformation: What could you do/would you need to do to clean or modify the existing data to create new values to work with? What other data could you imagine would be valuable to consolidate the existing data?

Exploration: Using a tool of your choice (such as Excel, Tableau, R) to visually explore the dataset in order to deepen your appreciation of the physical properties and their discoverable qualities (insights) to help you cement your understanding of their respective value. If you dont have scope or time to use a tool, use your imagination to consider what angles of analysis you might explore if you had the opportunity? What piques your interest in this subject?

(You can, of course, repeat this exercise on any subject and any dataset of your choice, not just those on Kaggle.)

Assignment Link: http://book.visualisingdata.com/chapter/chapter-4

Pass A Value To A Function That Makes A Decision


Instructions

You will write a flowchart, and C code for a program that does the following:

  1. Within main(), it asks for the user’s annual income.
  2. Within main(), it calls a function called printIt() and passes the income value to printIt().  
  3. The printIt() function evaluates the income, and if the number is  over 90000, prints a congratulatory message.  If the income is not over  90000, it prints a message of encouragement, like “You WILL make  $50,000, if you keep going.”

Here is what the output looks like.

Submission Instructions

Upload your Flowgorithm file, your .c file, and a screenshot of your code output saved in a Word document 

Passing Variables By Address


Instructions

You may pass variables to functions either by address or by value. If  you pass a variable by address, then both functions will see the  changed value of the variable (if the value changes). If you pass a  variable by value, you are really passing a copy of the variable, and  the calling function will not see the changed value of the variable (if  the called function changes its value).

Of note in this example:

You pass a variable by prepending the variable name with an ampersand (&).

The receiving function (in this case, do_fun()), prepends the  variable name with an asterisk (*). This tells the receiving function  that it’s receiving the variable’s address, not a copy of the  variable.  

Notice that the new value of the variable amt is visible in the do_fun() function and in main().

Here is the code:

And here is the output:

Submission Instructions

Now, you enter the code, and run it. (No flowchart this time)

Upload your .c file and a screenshot of your code output saved in a Word document

Passing User Values To A Function And Using The Return Value Of The Function


Instructions

This program gets values from the user, and then runs a calculation.  The values are passed by reference (by address), so the main() function  sees the changed values of the variables. The first function  (getValues()) gets user input. The second function (calcCubic), performs  the calculations, and the third function (printCubic()) prints the  value of the calculation.

Here is the code:

And here is the output:

Unit 3 Guided Practice 6 Output.JPG

Submission Instructions

Now, you enter the code, and run it. (No flowchart this time)

Upload your .c file and a screenshot of your code output saved in a Word document 

Write And Call Three Functions


Instructions

You will write a flowchart, and C code for a program that does the following:

Call three functions from main(). The functions are named first(),  second(), and third(). Each function prints out its name (“first,”  “second,” “third.”). After all three functions are called, the main()  function should print “End of program.”

Here is what the program looks like.

Submission Instructions

Upload your Flowgorithm file, your .c file, and a screenshot of your code output saved in a Word document 

DB Project Modeling And Design

 Assignment Details

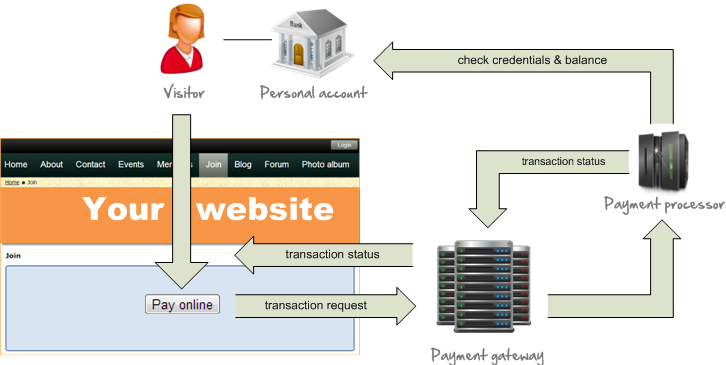
You are working as a Quality Assurance Engineer. Your system integrates with several different systems. The following is an example of a high-level architecture diagram:

(Wild Apricot, n.d.)

Post the following for this discussion:

  • Describe the challenges related to system integration testing in the above scenario.
  • Provide at least 2 of the most important test cases that should be tested in the above architecture.

Project Modeling And Design


You are working as the software tester for a big enterprise company. Your company is working on the following architecture:


(Daniel, 2016)

Address the following, and complete all of the sections based on the above architecture:

  • Submit a System Test Plan document that contains the following:
    • Purpose of the document
    • Functional scope
    • Testing strategy
    • System testing entrance criteria
    • Test data
    • Suspension criteria
    • Execution plan
    • Defect reporting
    • Test schedule
    • Environment
    • Risks
    • Assumption
    • Who-to-call list

Wk 1 – IT Governance

  1.    Read the .

    Imagine you are the IT manager for Gail Industries. You will meet with a new business analyst team at the Smallville customer site. The project sponsor has asked you to spend time with the business analyst team to emphasize the importance of IT governance.

    Create a 10- to 12-slide media-rich overview and brief analysis presentation with speaker notes in which you:

    • Examine the role of IT governance and why it is important in the IT industry.
    • Analyze key aspects of IT governance, including enterprise resource planning and transaction processing systems.
    • Please note that all assignments are required to have a minimum of 3 references with in-text citations. If you are unsure of what is required, please ask well in advance.

      Media-rich: means that there are visuals and possibly audio files that enhance the slides. Examples might be charts, diagrams, graphics, photos, videos, voice overs, etc.

      Slide presentations are meant to engage an audience! They should present concise information in readable type, with media that enhances the information. Speaker notes are where more information can be placed. (Keep in mind all of the boring powerpoint presentations you have attended and avoid making your presentation the same way.)

      Format citations according to APA guidelines.

      Submit your assignment.

      Presentation Expectations
      Multimedia presentations should engage the intended audience through graphics, diagrams, photos, and text used in a concise manner. Speaker notes should round out the content material.
      —- Content: details for each topic required in assignment –
      —- Speaker notes : this is where the details and data should be
      —- Text : large enough for audience to read / bulleted points / legible fonts
      —- Audience Engagement: good, due to a balance of visual elements – too many ‘bells and whistles’ can be distracting but people are engaged by photos and graphics!
      ___ Images should be compelling and create interest. Use charts, diagrams, images of people, etc.
      __ Additional Media: Music, voice overs, videos and animations can add to a presentation if not overdone.
      —- Format:
            Title page
            Summary page
            References: included w/ APA style